Having incredibly configurable, robust, scalable, and efficient logging is just one reason to put Varnish at the outer most layer of your infrastructure. Commonly to Varnish is used just for logging, even when no caching is being done.
Varnishncsa is a separate process than Varnish, with a shared memory buffer, allowing you to control multiple log streams, how they are filtered, how they are formatted, and also ensuring the main process isn’t bogged down with logging. In this tutorial we will look at all the parameters that can be logged and then create a varnishncsaa format string to log them in JSON. Here are the steps.
- Varnishlog vs. Varnishncsa
- Determine the List of Parameters That Can Be Logged
- Set Up Varnish and Varnishncsa
- Examine the Logs
- Ensure Logrotate Is Set Up
- Log Just What Is Useful
Varnishlog vs. Varnishncsa
While varnishlog is the more complete log format, and your best choice for debugging, varnishncsa is a common choice for log aggregation and long time storage because it is formatted as one line per request, and it has a regular schema that can easily be inserted into an SQL database.
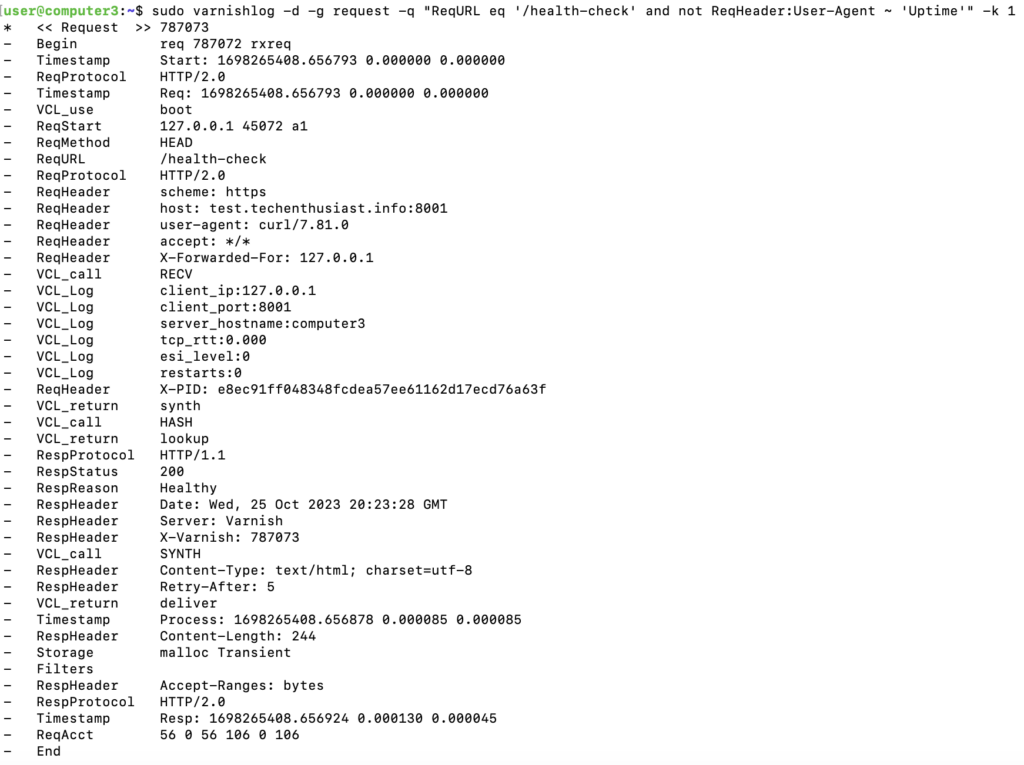
Here is an example of varnishlog:
And here is an example of three requests in vanrishncsa:

Unlike varnishlog, in varnishncsa each field appears exactly once, whether it is present in the raw log 0, 1, or multiple times. Consider an example of VCL that changes the Host request header multiple times. Will each of these values appear in varnishncsa?
sub vcl_recv {
    set req.http.Host = "host1";
    set req.http.Host = "host2";
    set req.http.Host = "host3";
}
Load this vcl and make a request via curl.
sudo nano /etc/varnish/default.vcl
// add req.http.Host lines
sudo systemctl reload varnish
curl http://localhost:6081
The top of the log generated from this VCL looks like this.
sudo varnishlog -d -g request
*   << Request  >> 5
-   Begin          req 4 rxreq
-   Timestamp      Start: 1696871170.572942 0.000000 0.000000
-   Timestamp      Req: 1696871170.572942 0.000000 0.000000
-   VCL_use        reload_20231009_170553_45389
-   ReqStart       127.0.0.1 45602 a0
-   ReqMethod      GET
-   ReqURL         /
-   ReqProtocol    HTTP/1.1
-   ReqHeader      Host: localhost:6081
-   ReqHeader      User-Agent: curl/7.88.1
-   ReqHeader      Accept: */*
-   ReqHeader      X-Forwarded-For: 127.0.0.1
-   VCL_call       RECV
-   ReqUnset       Host: localhost:6081
-   ReqHeader      host: host1
-   ReqUnset       host: host1
-   ReqHeader      host: host2
-   ReqUnset       host: host2
-   ReqHeader      host: host3
-   VCL_return     hash
-   VCL_call       HASH
So, if we log the Host header within varnishncsa, which will we get? Referencing the ‘man varnishncsa’ Format section, the answer is:
- If we use ‘
%{Host}i‘, we will get the last occurrence, ‘host3’ - If we use ‘
%{VSL:ReqHeader}x‘ we will get the first occurrence, ‘localhost:6081’ - If we want to get the middle occurrences, we must add an std.log statement like ‘
std.log("second_header_header:" + req.http.Host);‘
Here is some VCL that will allow us to get all the values:
import std;

sub vcl_recv {
    set req.http.Host = "host1";
    std.log("second_host_header:" + req.http.Host);
    set req.http.Host = "host2";
    std.log("third_host_header:" + req.http.Host);
    set req.http.Host = "host3";
}
Add the above to the VCL in ‘/etc/varnish/default.vcl‘ and reload varnish.
sudo nano /etc/varnish/default.vcl
// add import std; and std.log lines
sudo systemctl reload varnish
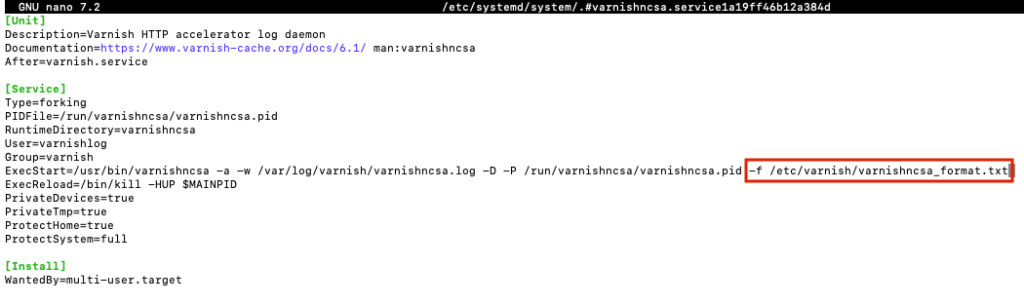
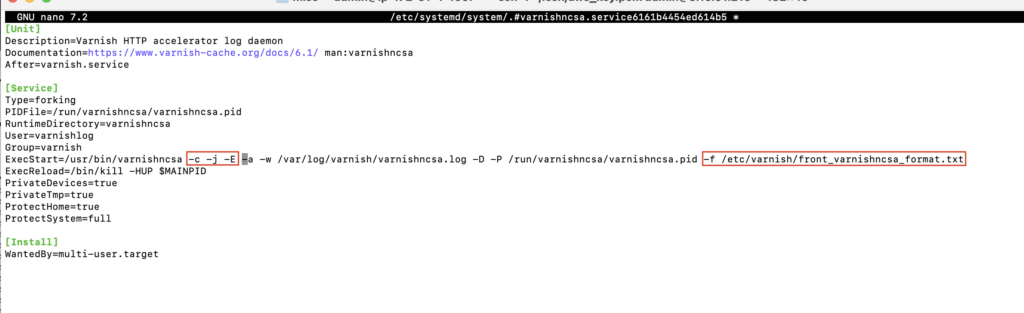
Here is a varnishncsa log format string that will show us all these Host header values as JSON. I am storing the format string in a .txt file '/etc/varnish/varnishncsa_format.txt‘ to remove the need for escape characters that would be required to include it directly in a systemd service file.
{"initial_host_header":"%{VSL:ReqHeader}x","second_host_header":"%{VCL_Log:second_host_header}x","third_host_header":"%{VCL_Log:third_host_header}x","final_host_header":"%{Host}i"}I add the ‘-f‘ parameter to the varnishncsa systemd service file:
sudo systemctl edit --full varnishncsa
‘Ctrl + o, Enter, Ctrl + x’ to save and exit nano. Now, I make a curl request, and check what was logged in /var/log/varnish/varnishncsa.log.
curl http://localhost:6081
sudo tail /var/log/varnish/varnishncsa.log -n 1
Here is the output.
{"initial_host_header":"Host: localhost:6081","second_host_header":"host1","third_host_header":"host2","final_host_header":"host3"}As you can see, we are able to get all 4 values of the Host header, if we really want to. Finally, let’s validate that this log line is valid JSON; this will be important for downstream processes that are handling these logs.
sudo apt-get install -y jq
sudo tail /var/log/varnish/varnishncsa.log -n 1 | jq -e . >/dev/null 2>&1 | echo ${PIPESTATUS[1]}

The response is ‘0’, which is the expected response if jq is able to parse the JSON without error.
Determine the List of Parameters That Can Be Logged
What are all the things that can be added into Varnishncsa logs? Here are some places we can look.
- The ‘Format’ section of ‘man varnishncsa’.
- VSL Tags in varnishlog
- Documentation on VSL Tags
- The Symbol Table from compiling VCL
- Fields in any vmods we want to log
Some of these items will be available directly, and others, we will need to explicitly add to the log using the vmod std log function, ex: std.log("esi_level:" + req.esi_level);. As we go, I will document each source of information and generate the final varnishncsa format string on this Google Sheet:
The ‘Format’ section of ‘man varnishncsa’
You can see this by running ‘man varnishncsa’ on any server with Varnish installed. It can also be seen in GitHub here. The initial section details some shorthand symbols for commonly wanted attributes like request URL, bytes received and sent, etc. However, we don’t actually need those; we should be able to get everything we want using the general VSL Tag and VCL Log selectors:
- VSL:tag:record-prefix[field]
- VCL_Log:key
If a field isn’t already available as a VSL tag, we can make it available with a std.log statement in VCL. Because the VSL_tag takes the first instance of a tag, it convenient to also use:
- %{X}i
- %{X}o
for cases when we want the last instance of a request or response header, instead of using std.log statements to explicitly label these. Finally, it is also convenient to include:
- %U
- %q
- Varnish:handling
- Varnish:side
Which can also be gotten via std.log calls, but that adds a little bit of overhead to Varnish, so why not use the provided symbol? More detail on how the available varnishncsa format symbols can be mapped to just the set above can be seen here. Now that we have boiled down our set of format symbols, we still need a list of VSL Tags and std.log tags to include in our format string.
VSL Tags in varnishlog
The next place to look is varnishlog, which contains the VSL tags that we have to choose from.
sudo varnishlog -d -g request
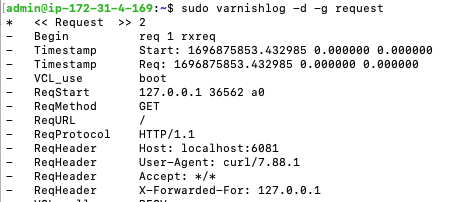
This can be copy and pasted into a Google Sheet and pulled into the varnishncsa format string. You can check this out here. The problem is, not every request has every VSL Tag. For example, only a request to a cacheable object being fetched without grace will have ‘Timestamp:Waitinglist‘ in Varnishlog. This may occur only rarely or never depending on your setup and request load. While we can try to capture many different logs and aggregate the VSL Tags between them, it will be much easier and guaranteed complete for us to get the list of all possible VSL Tags directly.
Documentation on VSL Tags
Here are three sources of VSL Tags I was able to find:
Between the three, I found ‘man vsl‘ to be a superset of the others, and also it is very likely to be exactly relevant to the specific version of Varnish I am running, which in this case is 7.1.1 (sudo varnishd -V). You can see all the VSL Tags and Timestamps here. I have attempted to label them by request context, either ‘Frontend’, ‘Backend’, ‘Both’, or ‘Neither’.
I found that certain VSL Tags cause varnishncsa to error out when starting up, including
- Debug
- HTTPGarbage
- Hash
- H2RxHdr
So, I removed these from the format string. For VSL Tags with multiple components, I am pulling in the entire array, except for timestamps, where I did the following:
- For ‘start’, pull in [1], which is the epoch time
- For all other timestamps, pull in [3], which is the incremental time since the previous timestamp
- Plus, a bonus ‘ttlb’ which pulls in [2] on ‘Resp’ (Frontend) and ‘BerespBody’ (Backend), showing the time since the request started until the last byte was sent/received.
The Symbol Table from compiling VCL
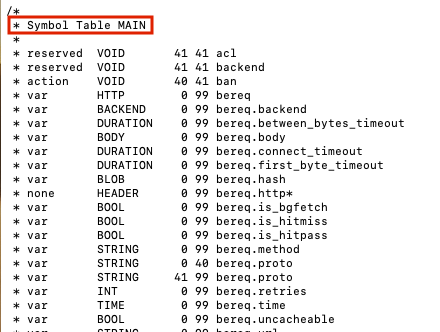
Now that we have all VSL Tags, there are still additional variables in Varnish that can only be surfaced via an std.log statement. While these will vary from VCL to VCL, we can get the base set by examining the symbol table which is outputted as part of the VCL compilation routine from any VCL. Assuming you have varnish installed (sudo apt-get install -y varnish), you should have a VCL file at ‘/etc/varnish/default.vcl‘. Run the following.
sudo varnishd -C -f /etc/varnish/default.vcl
If you scroll up a bit you’ll see a table of symbols starting with the text ‘* Symbol Table MAIN’. You can see the full symbol table from one of my VCL files here, as well as some formulas to translate variables into std.log VCL lines as well as vanrishncsa format string fragments.
Through testing I’ve found some of these variables cannot be logged; for example
- bereq.body
- obj.proto
- beresp.backend.ip
Some of these are relics from an older version of Varnish, still known to the compiler but unable to be referenced in VCL.
Fields in any vmods we want to log
There are some extra log items from vmods under ‘miscellaneous’. They are:
- The server port using vmod std.port
- The client port using vmod std.port
- TCP round trip time estimate using vmod std
Note that vmod std comes pre-installed while vmod tcp needs to be installed with the following:
sudo apt-get install -y varnish-modules
The TCP round trip time adds a lot to our knowledge of how fast varnish is able to serve clients. Consider that Varnish doesn’t know the client’s TTLB, since the delay in data sent over the network can only be measured on a client device, not from the server that sent that data. Varnish can only measure server side TTLB, or the time until Varnish sent the last byte. With the TCP round trip estimate, we can estimate client side TTLB:
server side TTLB + estimated TCP Round Time Trip = estimated client side TTLB
tcp.get_estimated_rtt() gives feedback on how well DNS is doing at connecting clients to the closest possible node, and how much overhead is being added by Load Balancers. Because of how useful this is, I add it to every varnish setup I make. The VCL we will be adding for logging tcp round trip time estimate looks like this.
vcl 4.1;
import std;
import tcp;

sub vcl_recv {
    std.log("tcp_rtt:" + tcp.get_estimated_rtt());
}
Set Up Varnish and Varnishncsa
The final frontend and backend Varnishncsa format strings and VCL lines to add can be seen in Google Sheets here. Below are fully created files for each, and where they should go. Save the contents of each of these location the path specifies.
- /etc/varnish/default.vcl
- /etc/varnish/front_varnishncsa_format.txt
- /etc/varnish/back_varnishncsa_format.txt
One way to set this up is the use the existing varnishncsa systemd service for frontend, and create a new systemd service for the backend.
sudo systemctl edit --full varnishncsa
I added four parameters:
- ‘-c’ to log only client side (Frontend)
- ‘-j’ to format values as JSON
- ‘-E’ to include ESI sub-requests
- ‘-f’ to load the format string from a file
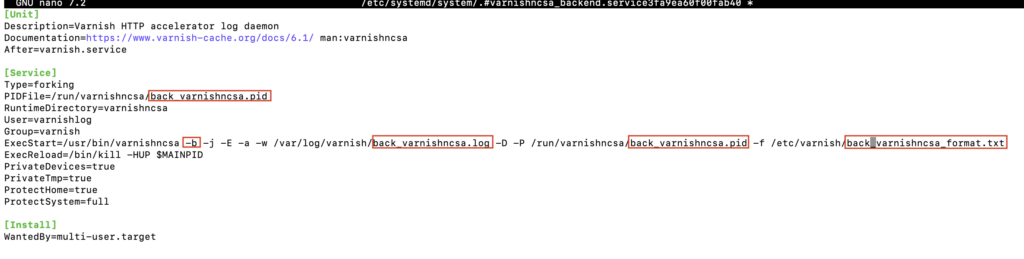
‘Ctrl + o, Enter, Ctrl + x’ to save and exit nano. Now, create a systemd service file for a new service called ‘varnishncsa_backend.service’ that is a copy of ‘varnishncsa.service’.
sudo cp /etc/systemd/system/varnishncsa.service /etc/systemd/system/back_varnishncsa.service
sudo systemctl edit –full back_varnishncsa
I made 4 changes:
- Update the PID file to ‘/run/varnishncsa/back_varnishncsa.pid’ in two places
- Change the ‘-c’ parameter to ‘-b’ for backend requests
- Change the format file to ‘/etc/varnish/back_varnishncsa_format.txt’
- Change the output file to ‘/var/log/varnish/back_varnishncsa.log’
‘Ctrl + o, Enter, Ctrl + x’ to save and exit nano. Now lets enable both varnishncsa services, start them, reload varnish, and check the status of all three.
sudo systemctl enable varnishncsa back_varnishncsa
sudo systemctl restart varnishncsa back_varnishncsa
sudo systemctl reload varnish
sudo systemctl status varnish varnishncsa back_varnishncsa
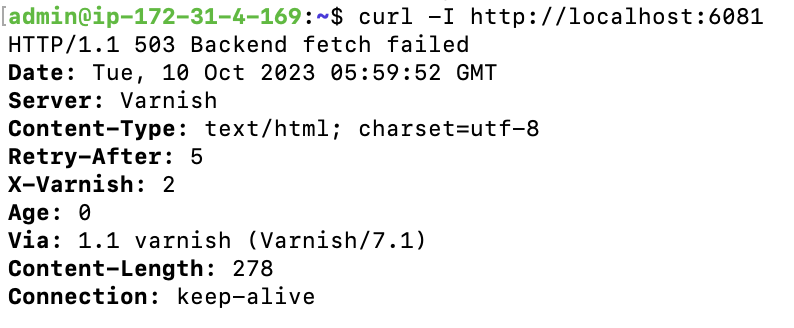
If the status of all three services is active (running), make a curl request to varnish.
curl -I http://localhost:6081
While this is a 503, that is actually what we expect if there is no backend listening on port 8080.
Examine the Logs
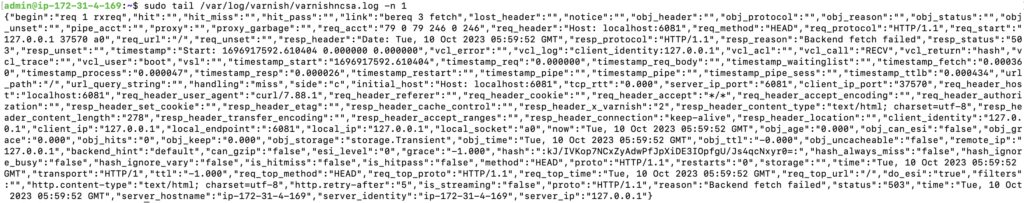
Now let’s take a look at what was logged. Here is how we can check on the frontend side. You can see the full log as text here.
sudo tail /var/log/varnish/varnishncsa.log -n 1
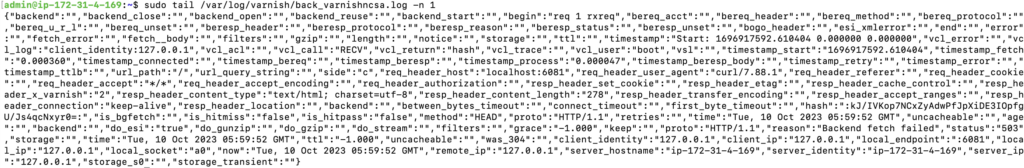
Let’s also take a look at the backend side. You can see the full log as text here.
sudo tail /var/log/varnish/back_varnishncsa.log -n 1
Now that’s a lot of data! Just as before, I’m going to validate that both are proper JSON.
sudo tail /var/log/varnish/varnishncsa.log -n 1 | jq -e . >/dev/null 2>&1 | echo ${PIPESTATUS[1]}
sudo tail /var/log/varnish/back_varnishncsa.log -n 1 | jq -e . >/dev/null 2>&1 | echo ${PIPESTATUS[1]}
For both commands I got a ‘0’, meaning jq was able to parse the text into JSON without an error.
Ensure Logrotate Is Set Up
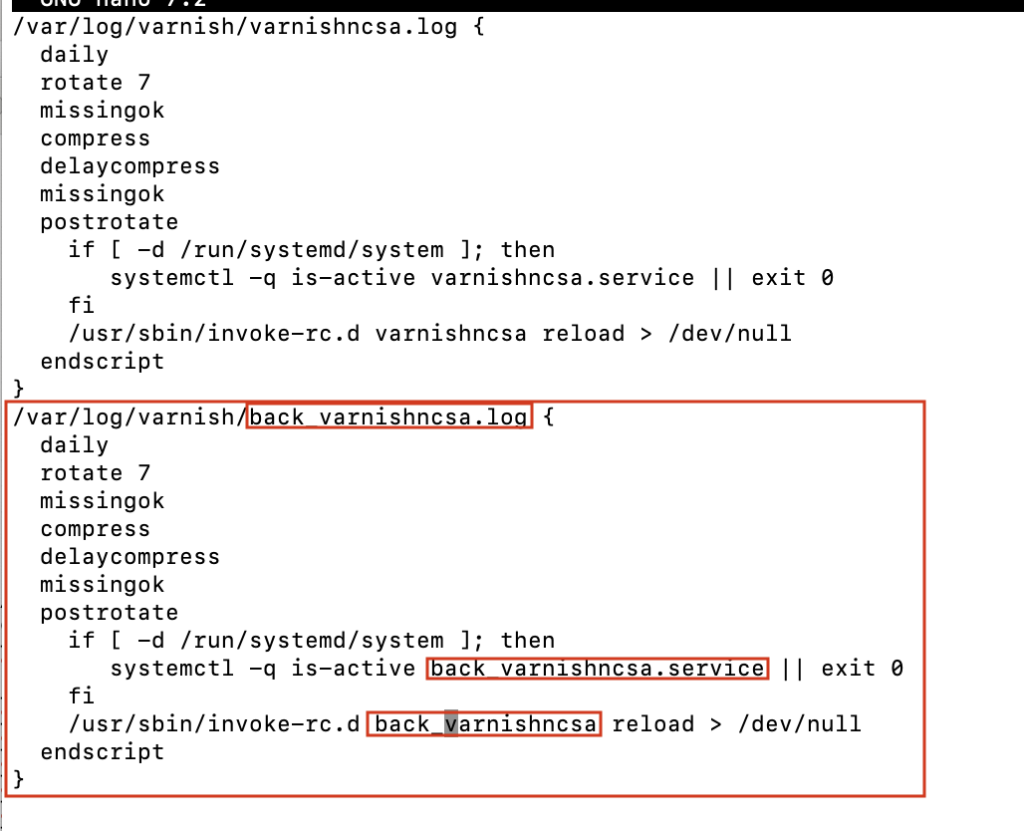
As logs are generated and written to disk, we want to ensure the logs are rotated to avoid a runaway buildup of disk utilization. Varnish comes with a logrotate config at ‘/etc/logrotate.d/varnish‘. We need to update this config to also rotate the new log file we created, which is '/var/log/varnish/back_varnishncsa.log‘
sudo nano /etc/logrotate.d/varnish
We need to add a second section that is a copy of the top one, and everywhere the text ‘varnishncsa‘ appears, we need to replace that with ‘back_varnishncsa‘.
‘Ctrl + o, Enter, Ctrl + x’ to save and exit nano. We can force a logrotate event to test that our new policy is working as expected. First let’s take a look at /var/log/varnish.
sudo ls /var/log/varnish

In this case ‘varnishncsa.log‘ has already rotated once, but the brand new ‘back_varnishncsa.log‘ hasn’t rotated yet. Now, let’s force a rotation and view the directory again.
sudo logrotate /etc/logrotate.d/varnish --force
sudo ls /var/log/varnish

As you can see, we got a new entry for both ‘varnishncsa.log‘ and ‘back_varnishncsa.log‘. This is what is expected if the rotation is working correctly.
Log Just What Is Useful
While the logging you set up today is interesting and teaches us a lot about Varnish, the varnishncsa format string(s) I would recommend is a refinement of the ones we created today. In some ways this setup has redundant information being logged, and information that isn’t useful, and cases where the useful information is just one element in a space separated list of items within the JSON value, meaning it cannot be retrieved as easily as we’d like.
Leave a Reply