Observability, monitoring, and alerting are essential ingredients when it comes to ensuring that you are able to know when something is wrong, fix it right away, and prevent it from occurring again. For monitoring infrastructure I’m using Grafana Stack, including the following open source, free tools:
- Prometheus for pulling metrics off a variety of endpoints
- Node Exporter for server level metrics
- Prometheus Varnish Exporter for Varnish metrics
- NGINX Prometheus Exporter for NGINX metrics
- Postgresql Exporter for Postgresql metrics
- Promtail for shipping logs to loki
- Loki, a log aggregator and log query engine
- Logs To Table — a python script which queries Loki and inserts into Postgresql
- Grafana, for visualizing and alerting based on Loki, Prometheus, and Postgresql
Here is a look at some of the most useful dashboards I’m using today.
- Computer System Metrics
- Page Views
- Varnish Metrics
- NGINX Metrics
- Scraper
- Crawler
- IP Cycler
- Postgres Active Connections
- Postgres Metrics
- Alerts
Finally, here is a diagram of the architecture components, and what connects with what.
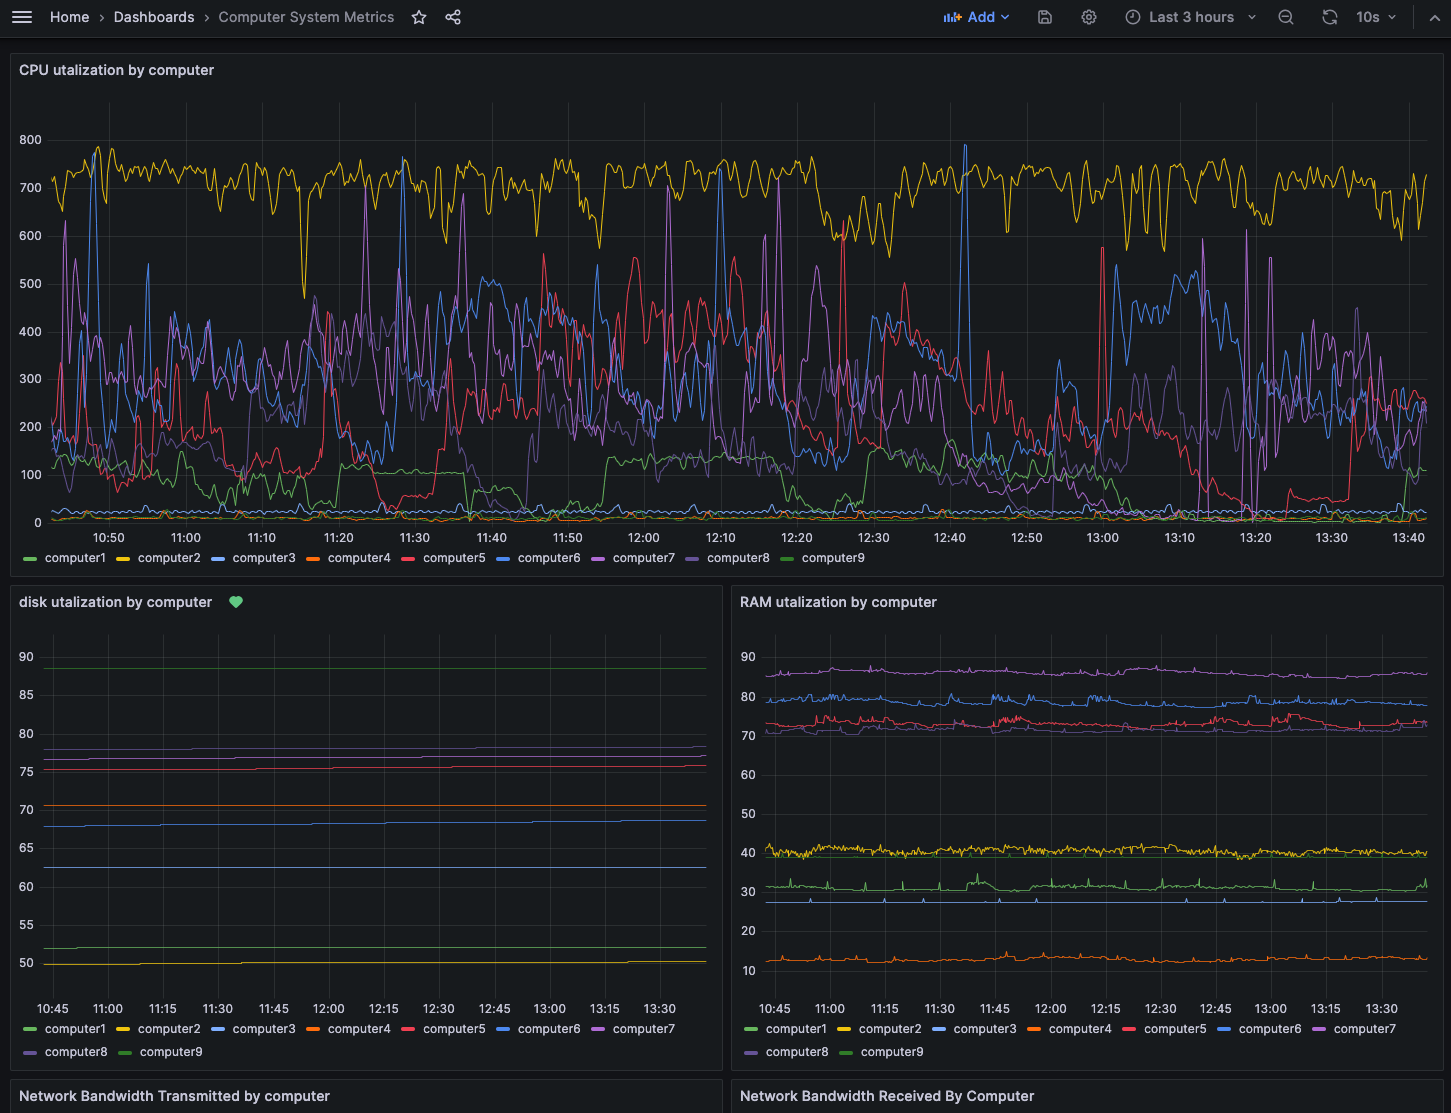
1) Computer System Metrics
I have 9 computers in my home network, and 1 in the cloud. I am monitoring CPU, Disk utilization and IO, RAM utilization, Network utilization, and temperature. This data is collected by Prometheus.
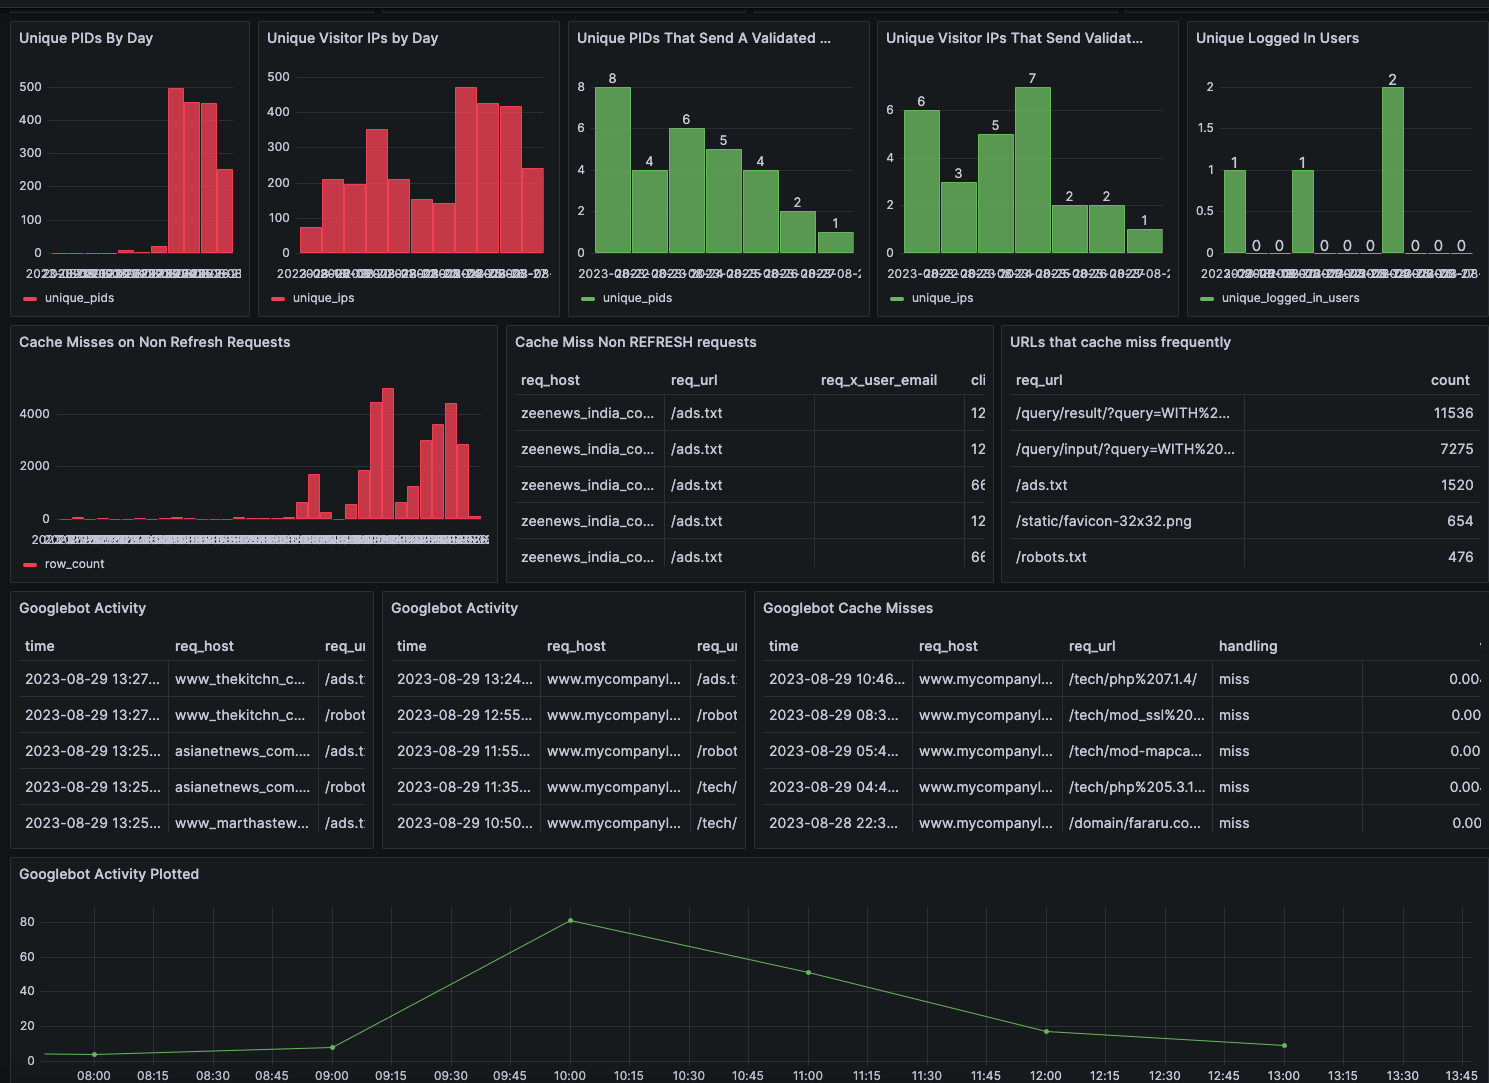
2) Page Views
I collect Varnish Logs via varnishncsa in JSON format. I literally collect ALL the fields you can, from client IP, handling (hit vs miss), TTFB, TTLB, whether or not the client sends a cookie. Because I want to do more analysis than what you can query quickly with inefficient log queries, I load the logs into Postgres. What you are looking at is total site traffic categorized by likelihood of that traffic coming from a bot, and a zoom in on the requests coming from Googlebot; including cache hit vs miss and server side TTLB.

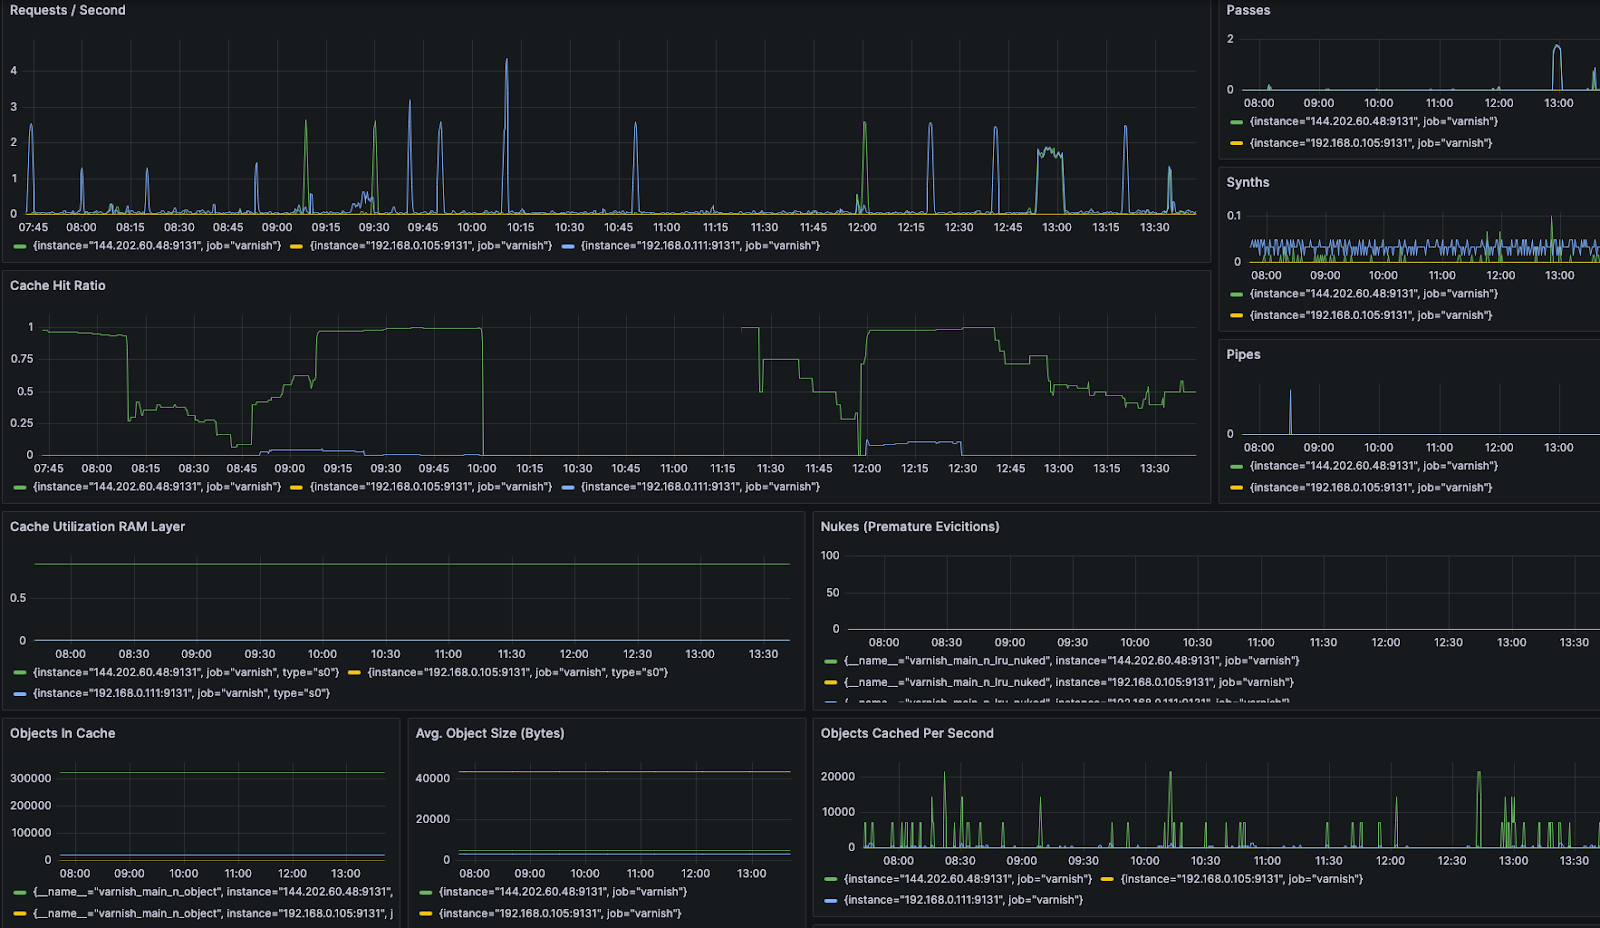
3) Varnish Metrics
Here we can see a variety of metrics related to requests / second, cache hit ratio, cache utilization, synthetic responses, etc. This is really useful for gauging backend health, spikes in traffic, and how well the caching strategy is conforming to the usage pattern.
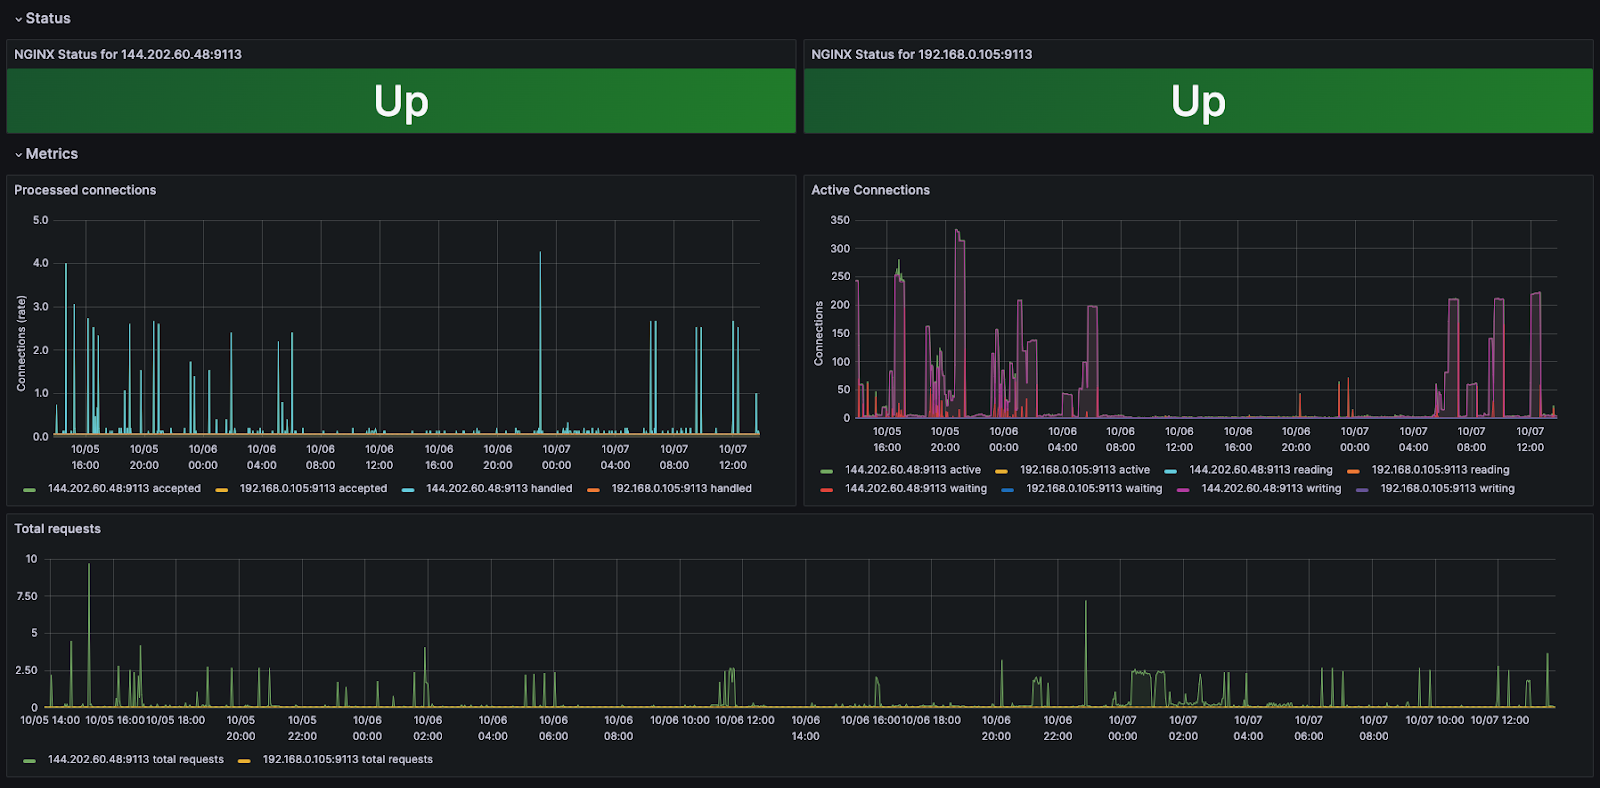
4) NGINX Metrics
Behind the first caching layer which is Varnish is a layer of NGINX. This is really useful because unlike Varnish, NGINX has a persistent cache that will survive a restart of the computer. Additionally, NGINX supports DNS based backends, backend TLS, and integrates nicely with Varnish for cache invalidation. Here we can monitor total requests, connections, and up status.
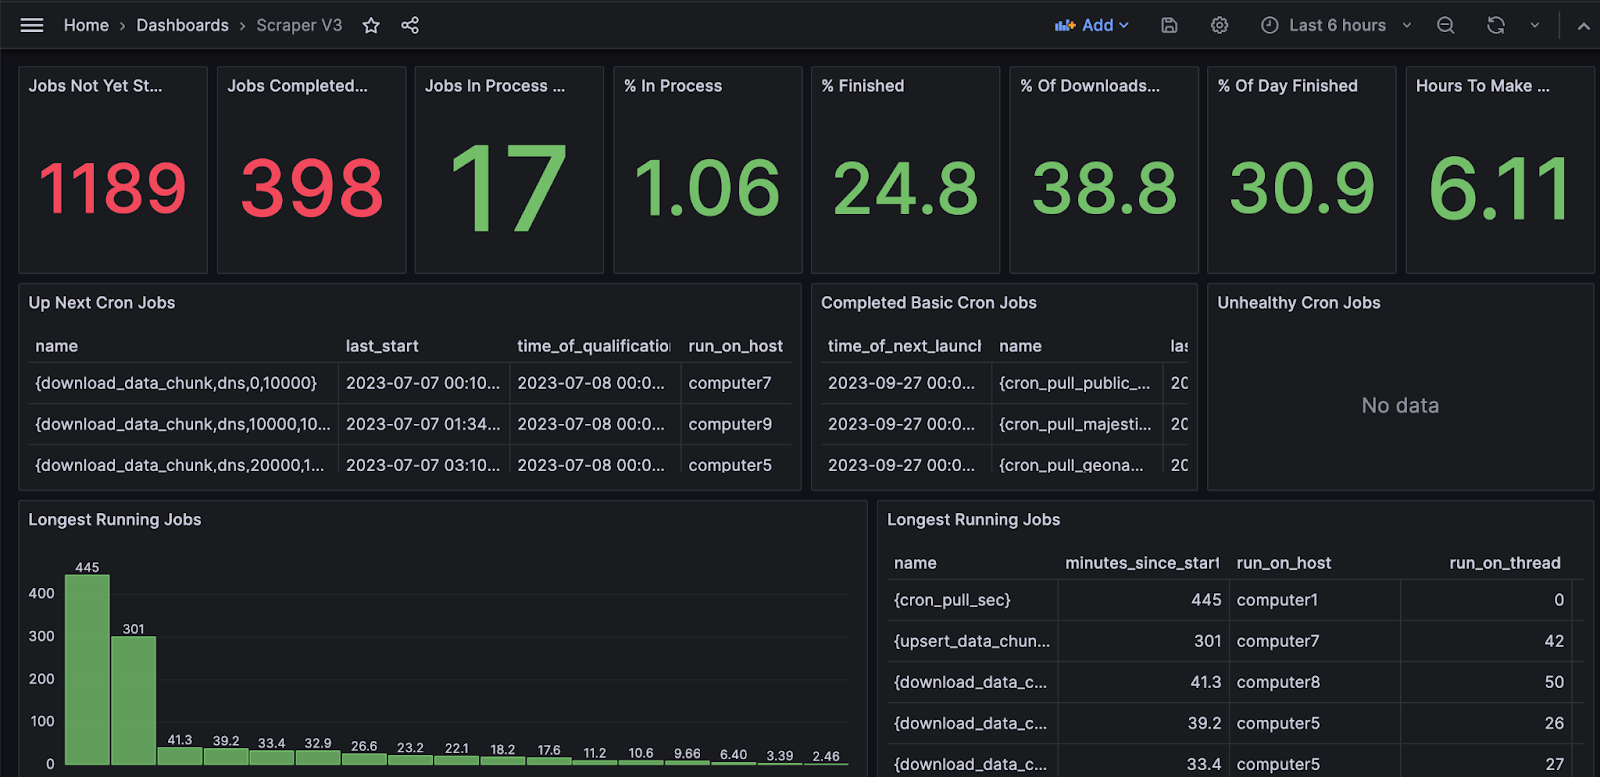
5) Scraper
Here is where I track the progress of jobs that collect data on 1 million URLs daily for My Company List. You can see how long different jobs are taking, if anything is stuck, and if the overall progress is on track to finish before the day ends. I have reduced jobs to do a single task each, which has helped identify exactly where bottlenecks are. For example, there is separate tracking for downloading, parsing, and upserting data.
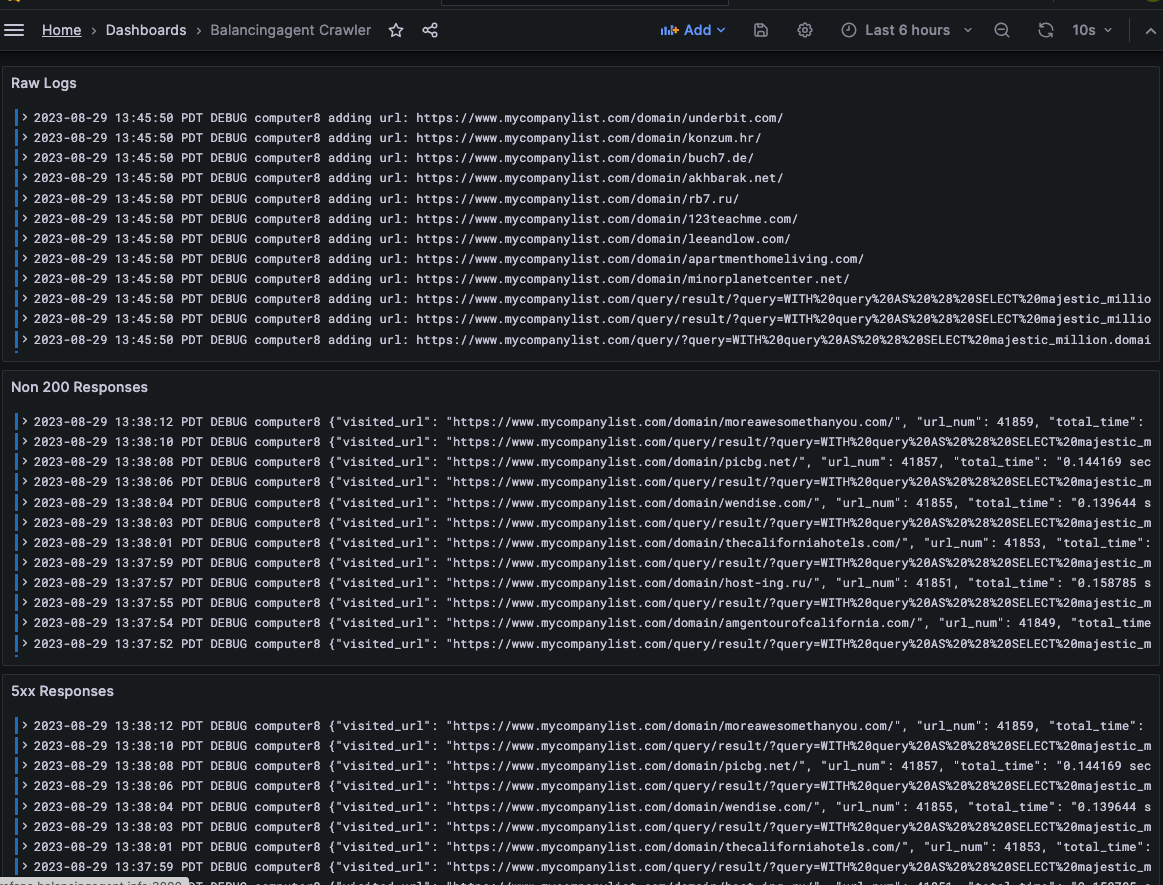
6) Crawler
Crawler is a cache prewarming robot that traverses a domain refreshing the cache. It also takes records of non 200 responses, linking structure, internal or external broken links, and client side ttlb.
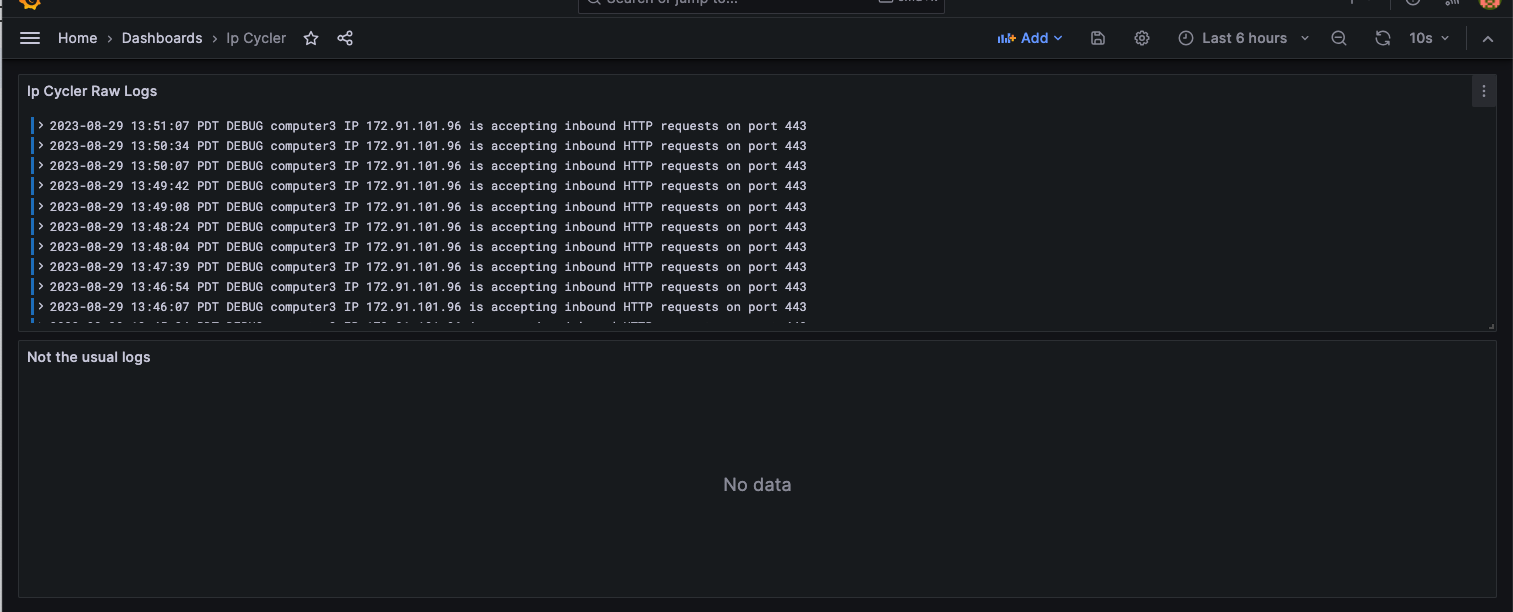
7) IP Cycler
The backend of the project runs on my home network on not the world’s best router or internet connection. I am using Keep Connect to power cycle the router when the internet goes out, which restores the connection. However invariably the port forwarding stops working upon router reboot, so I need to open up the router UI and release and then renew the public IP. Because TP-Link has put in safeguards to prevent bots from changing router settings, I needed to use Selenium and Python to achieve this result via browser automation.
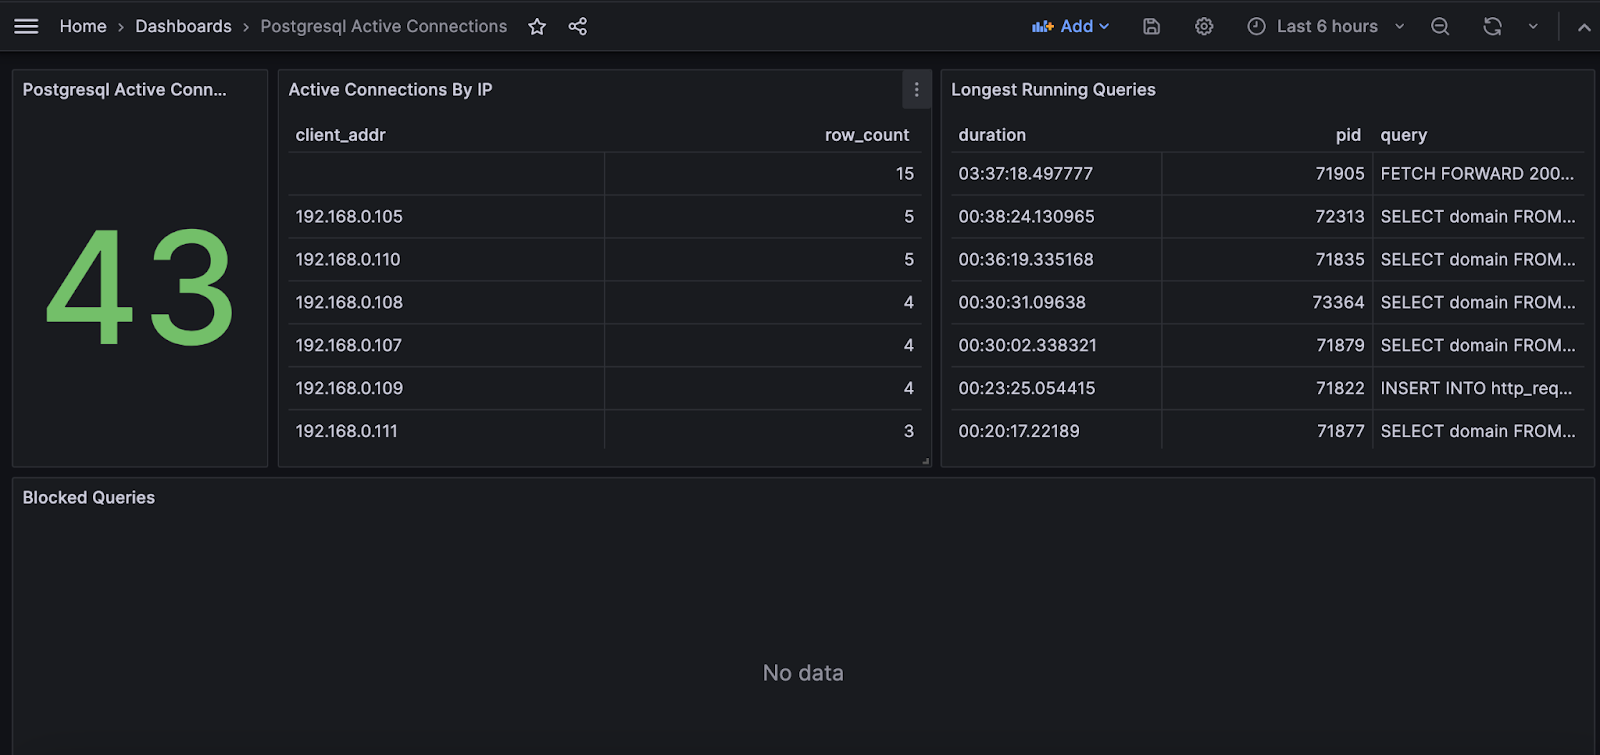
8) Postgres Active Connections
Here we can keep an eye on Postgres, the number of connections, duration of different queries, and if any queries are blocked.
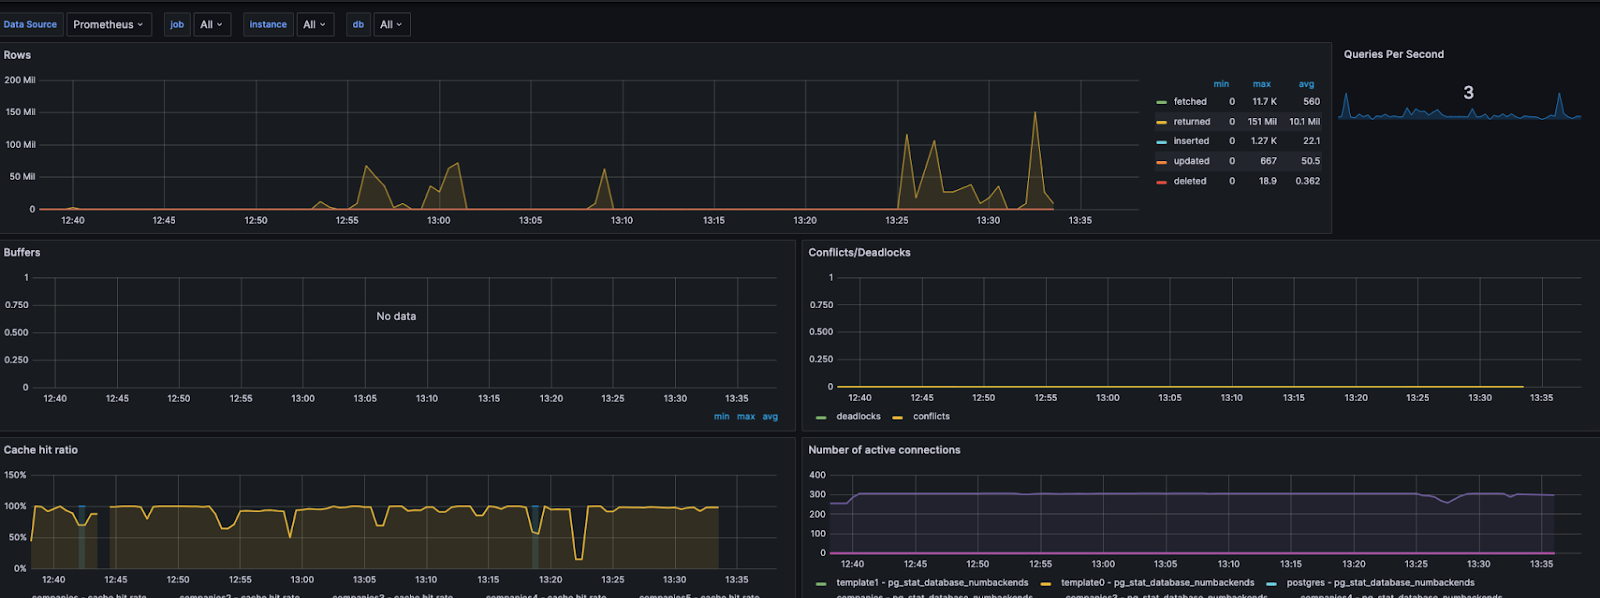
9) Postgres Metrics
This is similar to above but the data source is Prometheus instead of directly from Postgres. By using Postgresql Exporter, we can see a time lapse of data points that are only available as a snapshot when querying pg_stat tables directly.
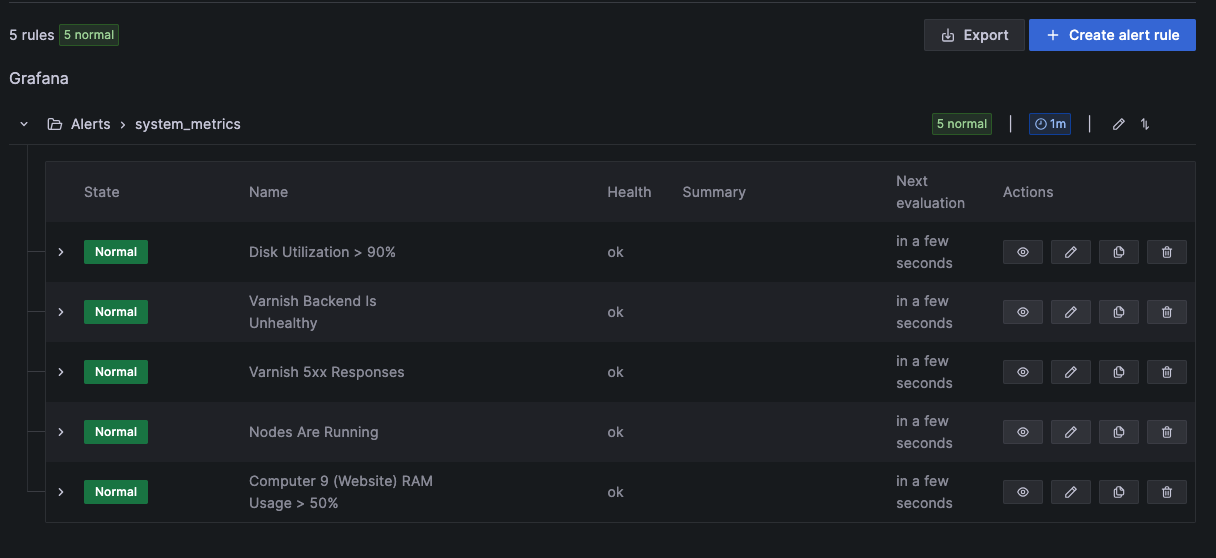
10) Alerts
As issues come up, make alerts to let you know when something is wrong, but aren’t too sensitive as to alert you too often for issues that aren’t severe enough to justify it.
Leave a Reply